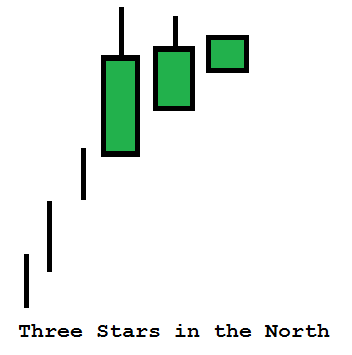
Three Stars in the South a Bullish Reversal Pattern
The Three Stars in the South is a powerful bullish reversal pattern that can signal a significant shift in market sentiment. Let's explore its characteristics and how to identify it correctly.
Pattern Description
The Three Stars in the South pattern emerges during a downtrend, gradually losing momentum as daily price movements become less pronounced. This pattern is defined by consecutively higher lows and a long lower shadow on the first day, which indicates increasing buying enthusiasm.
Identifying the Pattern
To correctly identify the Three Stars in the South pattern, keep an eye out for the following key rules:- The first day displays a long black candle with a distinct long lower shadow, resembling a hammer. The length of the shadow should be two to three times that of the candle's body.
- The second day resembles the first day in shape but is smaller in size. The low of the second day should be above the previous day's low.
- The third day features a small black marubozu candle that opens and closes within the range of the previous day's candle, without any wicks at the top or bottom.
Pattern Analysis and Psychology
The Three Stars in the South pattern reveals crucial insights into market psychology and potential trading scenarios. Here's what happens behind the scenes:- After establishing a new low during the downtrend, a rally occurs and closes well above the low. This sparks concern among short sellers, as it signifies buying activity that has been absent until now.
- On the second day, the market opens higher, allowing some long positions to exit. Although the price trades lower during the day, it does not breach the previous day's low. This leads to a rally that closes above the low, heightening the apprehension among bearish traders.
- The final day of the pattern is characterized by indecision and minimal price movement, represented by the small marubozu candle. Short sellers, already concerned about the higher low, become even more cautious, fearing any further upside movement.
Utilizing the Three Stars in the South Pattern
Understanding and applying the Three Stars in the South pattern effectively can provide valuable insights for traders and investors. Here are some ways you can utilize this pattern in your trading strategy:
- Bullish Reversal Signal: The Three Stars in the South pattern is primarily used as a bullish reversal signal. When you spot this pattern after a downtrend, it suggests a potential trend reversal and a shift in market sentiment from bearish to bullish. Traders can take this as a buying opportunity and consider entering long positions.

- Confirmation and Entry Points: To increase the reliability of the pattern, it's recommended to look for confirmation signals before taking action. This can include analyzing other technical indicators, such as trendlines, moving averages, or oscillators, to ensure that the overall market conditions align with the bullish reversal signal provided by the Three Stars in the South pattern. Once confirmed, traders can consider entering long positions at appropriate entry points.
- Stop Loss and Take Profit Levels: Risk management is crucial in trading, and setting proper stop loss and take profit levels is essential. Traders can place a stop loss order below the low of the pattern, protecting themselves in case the market doesn't follow the expected reversal. Take profit levels can be set based on other technical analysis tools, such as resistance levels, Fibonacci retracement levels, or previous price swings.
- Combining with Other Candlestick Patterns: While the Three Stars in the South pattern is powerful on its own, combining it with other candlestick patterns can enhance its effectiveness. Traders can look for additional confirmation from complementary patterns, such as bullish engulfing patterns, morning stars, or bullish harami, to strengthen the bullish reversal signal.
- Timeframe Considerations: Candlestick patterns can be applied to different timeframes, from intraday trading to long-term investing. It's important to consider the timeframe you're trading on and adjust your trading strategy accordingly. The Three Stars in the South pattern can be effective on daily, weekly, or even monthly charts, providing insights into potential trend reversals across various timeframes.

FAQs
Q1: How reliable is the Three Stars in the South pattern as a bullish reversal signal?
A1. The Three Stars in the South pattern is considered a reliable bullish reversal pattern, especially when it appears after a prolonged downtrend. However, it's essential to confirm the pattern with other technical indicators or candlestick patterns for increased reliability.
Q2: Can the Three Stars in the South pattern be applied to different timeframes?
A2. Yes, the Three Stars in the South pattern can be applied to different timeframes, including daily, weekly, or monthly charts. Traders should consider the timeframe they're trading on and adapt their strategy accordingly.
Q3: Are there any other candlestick patterns that complement the Three Stars in the South pattern?
A3. Yes, several candlestick patterns complement the Three Stars in the South pattern. Some examples include bullish engulfing patterns, morning stars, bullish harami, or even trendline breakouts. Combining multiple patterns can strengthen the bullish reversal signal.

Q4: How can I further improve my candlestick charting skills?
A4. Improving candlestick charting skills requires practice, studying historical charts, and observing real-time market movements. Consider using candlestick pattern recognition software, attending educational webinars or seminars, and analyzing the effectiveness of patterns in different market conditions.
Q5: Is candlestick charting suitable for all types of financial markets?
A5. Yes, candlestick charting is suitable for various financial markets, including stocks, forex, commodities, and cryptocurrencies. The principles of candlestick analysis can be applied across different markets and instruments.
By mastering the Three Stars in the South pattern and incorporating it into your trading strategy, you can gain a valuable tool for identifying potential bullish reversals and improving your overall trading performance. Remember to always practice risk management and combine candlestick patterns with other technical analysis tools for enhanced accuracy.
Happy trading and good luck on your financial journey!


