What is Trend Lines how to use: | Mastering Trend Lines & Comprehensive Guide for Traders
Introduction
In the world of trading, understanding market trends is crucial for making informed decisions. One popular tool used by many traders is trend lines. Trend lines provide a visual representation of the market's strength and weakness, helping traders identify potential entry and exit points. In this comprehensive guide, we will delve into the intricacies of trend lines and explore how to effectively use them in trading strategies.
Understanding Trend Lines
Trend lines are lines drawn on a chart to depict the direction and strength of a market trend. An uptrend represents a market moving from low to high, while a downtrend shows a market moving from high to low. Trend lines help traders visualize these trends and provide a framework for analyzing price movements.
Drawing Trend Lines
Drawing trend lines involves identifying significant points on a chart and connecting them to form a line. While the exact placement of trend lines can be subjective, it's essential to focus on key areas of price support and resistance. By aligning trend lines with clusters of price points, traders can create a more reliable representation of market trends.
Trend Lines in Uptrends
In an uptrend, traders seek opportunities to buy when the price hits the lower boundary of the trend line. This lower channel acts as a support level, indicating potential buying opportunities. It's important to align oneself with the trend and avoid entering long positions at the upper end of the channel, where the chances of further price increases are slimmer.
Trend Lines in Downtrends
Conversely, in a downtrend, traders look for opportunities to sell when the price reaches the upper boundary of the trend line. This upper channel acts as a resistance level, signaling potential selling opportunities. By aligning with the downtrend, traders can maximize their chances of profitable trades.
The Power of Trend Line Retests
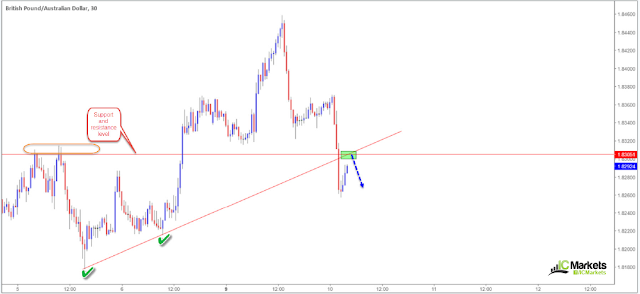
Trend line breaks and subsequent retests can provide valuable trading opportunities. When a trend line is broken, it may indicate a change in market direction. Traders can enter positions in the opposite direction as the trend line break, anticipating further price movements. However, it's common for prices to retest the broken trend line before continuing in the new direction, offering traders a second chance to enter trades.
Applying Trend Lines in Different Timeframes
Trend lines can be used effectively across various timeframes. By analyzing trends in daily, hourly, or even minute charts, traders can gain insights into short-term and long-term market movements. The principles of drawing trend lines remain the same, irrespective of the timeframe, providing traders with a versatile tool for analyzing trends.
Using Trend Lines as Entry and Exit Points
Trend lines serve as valuable indicators for determining entry and exit points in trades. In an uptrend, buying near the lower boundary of the trend line can offer favorable entry points. Conversely, selling near the upper boundary of the trend line can provide optimal exit points. By aligning trades with the prevailing trend, traders increase their chances of successful trades.
Trend Line Midpoints and Their Significance
Adding a midpoint to a trend line can help identify areas of market fatigue and potential reversals. The midpoint often acts as a key area where prices struggle to break through. By observing how prices interact with the midpoint, traders can make informed decisions about trade entries, exits, or potential reversals.
Trend Lines and Risk Management
While trend lines can be valuable tools for trading, it's important to practice proper risk management. Traders should set stop-loss orders to limit potential losses and protect their capital. By combining trend lines with sound risk management strategies, traders can enhance their overall trading performance.
Frequently Asked Questions (FAQs)
Q 1: How accurately should trend lines be drawn?
A 1: Trend lines can be subjectively drawn based on significant price points. It is more important to align trend lines with clusters of price activity rather than aiming for exact precision.
Q 2: How can trend lines be used in different timeframes?
A 2: Trend lines can be applied to various timeframes, allowing traders to analyze trends on both short-term and long-term charts. The principles of drawing trend lines remain the same regardless of the timeframe.
Q 3: Can trend lines be used for short-term trading?
A 3: Yes, trend lines are effective tools for short-term trading. By analyzing trends in shorter timeframes, traders can identify opportunities for quick profits based on trend line bounces or breaks.
Q 4: Should I always enter trades at trend line breaks?
A 4: While trend line breaks can indicate potential reversals, it is advisable to wait for price retests before entering trades. Retests offer confirmation and reduce the risk of false breakouts.
Q 5: How can I incorporate trend lines into my risk management strategy?
A 5: Traders should set appropriate stop-loss orders based on their risk tolerance when trading with trend lines. This helps limit potential losses and protects trading capital.
Conclusion
Trend lines are powerful tools for traders to identify market trends and make informed trading decisions. Whether in uptrends or downtrends, trend lines provide a framework for analyzing price movements and locating potential entry and exit points. By mastering the art of drawing trend lines and effectively using them in different timeframes, traders can enhance their trading strategies and improve overall profitability.


